Is Your Unreal Game CPU or GPU Bound? How to Tell and What to Do About It
How to Check Performance with Unreal's stat unit Command
- Click into command line execution field at the bottom left, or press the
~key located in top right of your keyboard to start typing
- Once the console is open, type
stat unit
This will display real-time timing statistics of your frame.
How to understand stat unit
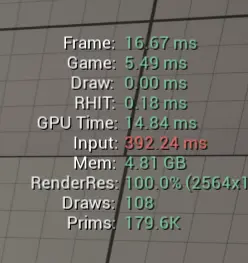
The statistics show you how long different parts of the engine are taking to process a single frame. The highest value is your primary bottleneck.
You game is CPU bound when
Game or Draw takes the longest
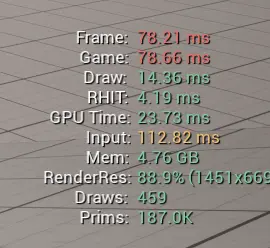
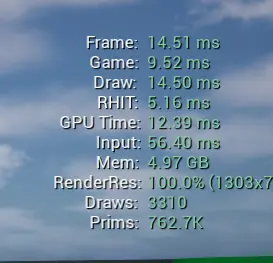
You game is GPU bound when
GPU Time takes the longest
How to make your game run faster
If Game is highest
It is likely that your game logic takes to long to run. You will need to focus on optimizing your gameplay code. Use a tool like Unreal Insights to identify what is slowing down the CPU
If Draw is highest
You probably have a lot of objects in the scene, that are not expensive to render, but it takes long time for CPU to issue all the draw calls to GPU. You will need to focus on reducing draw calls. Look into techniques like static mesh batching, and Instanced Static Mesh Component. Culling might be issue as well.
If GPU Time is highest
Graphics card rendering your game takes longest to run. If this is the case, you will probably need to dig deep and check what exactly takes long to render. Very often, it can be just one very heavy object.
Found the Bottleneck? Let's Fix It
stat unit tells you what is slow. FPSify tells you why.
Stop wasting time wrestling with complex profilers. We turn your game's trace files into a simple to-do list, so you can spend less time debugging and more time creating.
- Pinpoint the exact asset or code causing lag.
- Receive clear instructions for programmers and artists.
- Save countless hours and the cost of dedicated game performance expert.
Pre-register today to claim your free 7-day trial